





XAUUSD (Gold) - 1H Supply & Demand | How a Bearish Trend Was Born

1. What This Chart Is Actually Telling Us

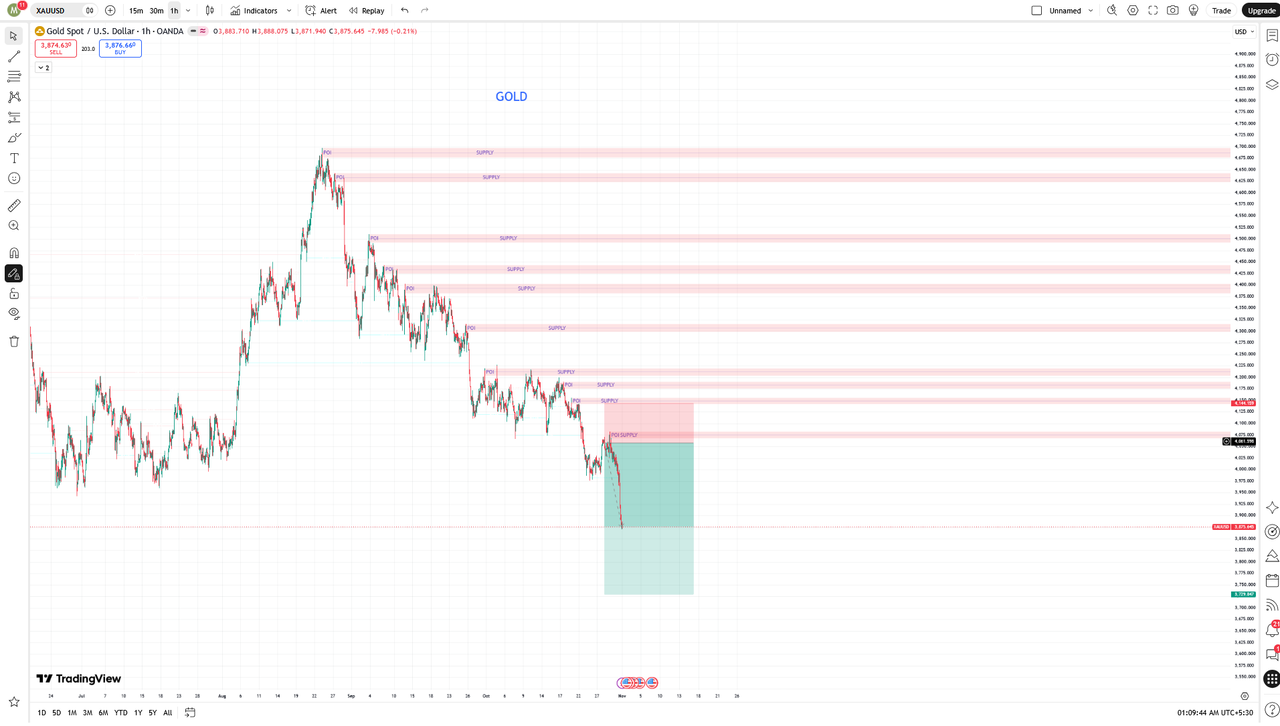
This is a 1-hour chart of Gold vs US Dollar from OANDA, covering roughly late August to mid-November. Price starts around 4,075, shoots up in a massive rally to almost 4,680, and then slowly bleeds all the way back down to around 3,900.

If you just look at the candles, it looks messy. But if you look at the pink and blue boxes, the whole story becomes clear.

This is not a signal. This is a breakdown of how a supply-and-demand trader would have read this chart in real time, why he kept looking for sells, and why price eventually came back to that one blue demand zone at the bottom.

The pink boxes are Supply Zones. The blue box at the bottom is a Demand Zone. And almost every pink box starts with a small label: POI - Point of Interest. Those POIs are the heart of this whole case study.

2. Top-Down View: What The Higher Timeframe Was Saying

Before we go deep into the 1H chart, we have to zoom out. A 1H chart alone can lie to you. A professional always starts from the top.

On the Daily timeframe, Gold had just finished a huge bullish run. It had gone up for weeks with almost no deep correction. That means it was extended. When a market gets that extended, smart money starts looking for a place to take profit, not a place to chase.

On the 4H timeframe, the first crack appeared at 4,680. Price made a strong high, then closed back below the previous 4H swing low. That was the first break of structure on the higher timeframe. It did not mean Gold would crash the next day, but it meant the easy bullish phase was over.

So when we come down to the 1H, we are not trading blind. We already know the Daily is overextended, the 4H has broken structure, and now the 1H is just giving us the precise entries to join the bigger move. This is top-down analysis. Daily gives the direction, 4H gives the bias, 1H gives the entry. When all three line up, that is when the high-probability trades appear.

3. The Shift: From a Strong Uptrend to a Downtrend

Let's come back to the 1H. In late August, Gold was around 4,075. From there, it went almost straight up. No real pullback. It crossed 4,300, then 4,500, then finally topped out near 4,680.

Everyone was bullish. News, YouTube, Twitter - everyone was talking about 5,000 Gold.

But that top near 4,680 was the first warning sign. Price got rejected hard from there and dropped to around 4,400. That was the first time big sellers showed up.

After that, price tried to go up again. And again. And again. But look closely:

First high: 4,680
Second high: 4,620
Third high: 4,510
Fourth high: 4,430
Fifth high: 4,300

Every single high is lower than the last one. That is a textbook bearish structure - Lower Highs. In an uptrend, you get Higher Highs and Higher Lows. Here we got the opposite.

A smart trader doesn't need an indicator to see this. The moment price failed to make a new high and started making lower highs, the bias flipped from buy to sell.

4. Supply Zones: Why Price Kept Getting Rejected

There are about 8-9 pink supply zones marked on this chart. A supply zone is simply a place where there are way more sellers than buyers. When price goes there, it falls.

How does a supply zone form? It forms from a POI.

A POI is that last small base or sideways move before price makes a sharp, impulsive move down. For example, look at 4,510. Price was hanging around there for a bit, then it dropped hard to 4,300. That 4,510 area becomes a POI.

Later, when price rallies back up to 4,510, what happens? It gets rejected again. This is called a retest or mitigation. The institutions who sold from there the first time still have sell orders left there. So they sell again.

The exact same thing happened at 4,430, 4,300, 4,220, 4,150, and 4,050. Price rallies up, touches the supply zone, prints a bearish candle, and falls again.

The strongest supply was the 4,680 - 4,620 zone at the very top. Price was rejected there twice, and after that, it never went back. That was the ceiling.

Retail traders were probably thinking, "Gold is going up again, let me buy." But supply-demand traders were thinking, "Until this supply breaks, I am only looking for sells."

That's the difference. One group trades what they hope will happen. The other group trades what the chart is actually showing.

5. The Demand Zone: The Last Hope at 3,900

Now look at the bottom. There is only one blue box - the demand zone around 3,880 - 3,900.

In late October, when price broke below 4,000, it fell very fast to 3,900. From there, it bounced sharply back up to 4,150. That tells us buyers were waiting there. People who wanted to buy cheap Gold had their orders there.

But notice what happened after that bounce. Price went up to 4,150, hit supply again, got rejected, and started falling again. The blue arrow drawn at the end of the chart shows the trader's expectation: price is going to come back down to that 3,900 demand zone again.

This is now the decision point. There are only two possibilities:

  1. Price comes to 3,900, buyers step in again, and we get another bounce.
  2. Price breaks below 3,900 with a strong 1H close, and then we open the door for 3,800 or even 3,750.

A professional trader doesn't guess which one will happen. He waits. He lets price come to the zone, and then he watches for confirmation.

6. The Psychology Behind This Move

This whole chart is not just candles. It's human psychology.

When Gold was at 4,680, there was FOMO everywhere. Everyone wanted to buy. That's exactly when smart money was selling. They need buyers to sell to. That is how liquidity works. Smart money needs a crowd to be on the other side of their order.

Then when price started falling, retail traders kept buying every dip, thinking they were getting a discount. But every dip was just a pullback into a supply zone, and they kept getting trapped.

In a bearish trend, the biggest mistake is trying to catch the bottom too early. The traders who sold from supply zones made money trade after trade. The traders who bought from support kept getting stopped out.

Also look at late October near 4,000 to 3,900. The red candles there are huge. That's panic selling. That's called displacement - when price moves fast with big candles, it means one side is in total control. After that panic, the bounce candles were small and slow. That means buyers were coming in, but they were not strong. Sellers were still in control.

7. What Would a Trade Plan Look Like?

If someone was trading this chart with a supply-demand strategy, the plan would have been very simple:

Bias: Bearish as long as price stays below 4,220 on the 1H.

Entry: Wait for price to come up to a supply zone. Don't sell in the middle of nowhere. Wait for price to reach the POI, then look for a bearish confirmation on the 15m or 5m - like a bearish engulfing, a pin bar, or a break of a small structure.

For example, if price came to the 4,150 supply, you'd wait for a bearish candle there and then sell.

Stop Loss: Just above the supply zone. If you sold at 4,150, your stop would be above 4,185. If price closes above the zone, your idea is wrong, you get out.

Target: For a short trade, the target is never the next supply zone below. Your target is the next demand zone, support, or swing low below. So from 4,150, first target is the swing low around 4,050, second target is the major demand zone at 3,900. That correction matters, because mixing up supply and demand in a plan is how traders take profit too early or hold too long.

Risk Management: Risk only 1 percent per trade. In this chart there were 8 supply zones. Even if you lost 3 trades and won 5, with a 1:2 or 1:3 risk-to-reward, you would still end up profitable. That's the math that most new traders ignore.

The key was patience. Not trading in the middle. Only trading at the zones.

8. Three Lessons From This Case Study

Lesson 1: Don't fight the trend.
Once Gold started making lower highs, the uptrend was over. Trying to buy in a downtrend because "Gold always goes up" is how accounts get blown.

Lesson 2: Zones work multiple times, but they get weaker.
A fresh supply zone is the strongest. The first and second retest usually work beautifully. By the third or fourth test, it starts to get weak. This chart is a perfect example - the first few supplies held perfectly, later ones started to get chipped away.

Lesson 3: Patience is the real edge.
Most of this chart is just noise in the middle. The money was made only at the pink boxes and the blue box. A professional waits for price to come to him. An amateur chases price.

In the end, this Gold chart teaches us one simple truth: The market never moves in a straight line. It moves in zig-zags, leaving behind supply and demand footprints. The trader who can read those footprints doesn't need to predict the future. He just needs to wait at the right place, with the right plan, and let the market come to him.

Right now, all eyes are on that 3,900 demand zone. What price does there will decide Gold's next big move - whether a multi-week reversal back toward 4,200, or a complete structural breakdown into 3,750.


Share:

What is Fair Value Gap (FVG)? And How Many Types Are There?


If you have ever watched price shoot up like a rocket and then come back to the exact same spot to give you an entry, you have already seen a Fair Value Gap in action. You just didn't know its name.

Most beginners think price moves in a straight line. It doesn't. Price moves like a person running in a hurry. He runs fast, leaves his shoes behind, then comes back to pick them up. That "coming back" is the whole game of SMC.

Let me explain it in the simplest way possible.

What is Fair Value Gap, Really?

Imagine you are at a market. Normally, one shop sells apples for 100 rupees, the next shop for 101, the next for 102. There is a smooth flow.

Suddenly, big news comes. Everyone rushes to buy apples. Price jumps from 100 straight to 110. No one sold at 101, 102, 103... 109. That empty space between 100 and 110 is a Fair Value Gap.

In trading, the same thing happens with candles.

When big institutions enter with huge orders, price moves so fast that it leaves a gap between one candle's high/low and the next candle's high/low. That gap is the imbalance. The market hates imbalance. It always wants to come back and "fill" that empty space, to check if there are still buyers or sellers left there.

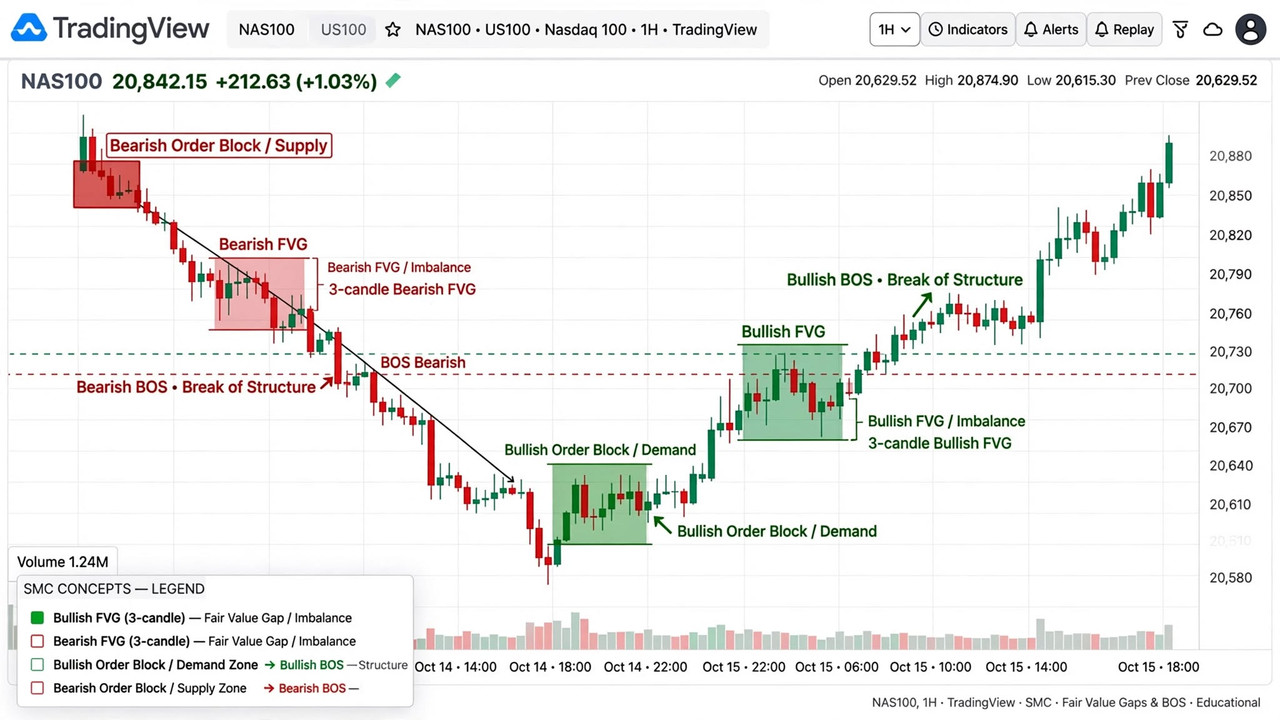
In technical terms, an FVG is formed by 3 candles.


Candle 1, Candle 2, and Candle 3. If Candle 2 is a big, strong impulse candle, and there is a space between Candle 1 and Candle 3 that price never touched, that space is the FVG.

That's it. No complicated indicator needed. Just 3 candles and one imbalance.

Traders use this zone for entry because when price returns to that gap, institutions often defend it. They left orders there. It's like they left a mark on the chart saying, "We bought from here, we will buy again from here."

Why Does Price Come Back to FVG?

This is the question every new trader asks me. "If price went up so strongly, why would it come down again?"

Because the move was too fast. It was unfair.

Think about it. When price moves too fast, many traders couldn't enter. The big players also couldn't fill all their orders. So price comes back, gives them a second chance, collects more liquidity, and then goes again.

That's why we don't chase. We wait. We wait for price to come back to the gap, show a little rejection, and then we enter. Patience pays. That's the whole philosophy behind FVG trading.

If you chase the breakout, you become liquidity. If you wait for the FVG, you trade with the institutions.

How Many Types of Fair Value Gap Are There?

This is where most YouTube videos confuse people. They say there are 100 types. Actually, there are only 2 main types. Everything else is just a variation of what price does AFTER the gap is formed.

Let's break them down one by one.

1. Bullish FVG = BISI

In institutional language, a Bullish FVG is called BISI - Buyside Imbalance Sellside Inefficiency.


Sounds complicated? It's not. It just means buyers were so aggressive that sellers couldn't keep up. There was inefficiency on the sell side.

You will see a big green candle in the middle. The low of Candle 3 is higher than the high of Candle 1. The space in between is your Bullish FVG / BISI.

What does it mean? Buyers are in control. The market left an imbalance below. When price comes back down into this gap, buyers are likely to step in again.

How to trade it? Don't buy at the top. Wait for price to retrace into the gap. Look for a small confirmation - a bullish engulfing, a rejection wick, a break of a small structure. Then enter with stop loss just below the gap.

I personally love Bullish FVGs after a liquidity sweep. Price takes out a low, sweeps all the retail stop losses, then shoots up and creates a Bullish FVG. That FVG is gold. Because the sweep already cleared the sellers.

2. Bearish FVG = SIBI

The opposite is called SIBI - Sellside Imbalance Buyside Inefficiency.


Here sellers were so aggressive that buyers couldn't keep up. There was inefficiency on the buy side.

Price falls aggressively. A big red candle in the middle. The high of Candle 3 is lower than the low of Candle 1. The space in between is your Bearish FVG / SIBI.

What does it mean? Sellers are in control. When price pulls back up into this gap, sellers are likely to defend it.

How to trade it? Don't sell at the bottom. Wait for price to rally back into the gap. Look for a bearish rejection. Then enter with stop loss just above the gap.

Bearish FVGs after a liquidity sweep of a high are the most powerful. Price takes the buy-side liquidity, then drops, creates a Bearish FVG. That is the classic smart money trap for retail FOMO buyers.

If you remember BISI and SIBI, you will sound professional in any SMC discussion. And more importantly, you will understand why the gap formed, not just where it formed.

These are the two main types. If you master just these two, you can trade for a lifetime.

But wait, there are 3 more types you MUST know, because they will save you from losing trades.

3. Mitigated FVG vs Unmitigated FVG

This is not a new shape. This is about the state of the gap.

If price has already come back and touched the FVG once, it's called Mitigated. The imbalance is already filled. The energy is used. Don't trade it again and again.

If price has NEVER come back to the gap, it's called Unmitigated. This is fresh. This is powerful. This is where you want to trade.

A simple rule I follow: Trade only the first time. First touch is the best touch. Second touch is weak. Third touch is a trap.

Many traders lose because they keep trading the same old FVG that price has already mitigated 3 times. Don't do that.

4. Inverse Fair Value Gap (IFVG)

This one is a little advanced, but very powerful.


Sometimes price comes back to an FVG, but instead of respecting it, it breaks straight through it. That failed FVG becomes an Inverse FVG.

Example: You had a Bullish FVG. Price comes down, but instead of bouncing, it closes below the gap. That Bullish FVG is now dead. It flips. Now it becomes a Bearish IFVG. When price comes back up to retest it, it will act as resistance.

Smart money uses IFVG to trap traders who are still buying the old gap. If you understand this flip, you will avoid a lot of false entries.

In my experience, IFVG works best on higher timeframes like H1 and H4. On M1 and M5, it gives too many fake flips.

5. Balanced Price Range (BPR)

This is the one most beginners miss, and it's the most premium concept.

Sometimes a Bullish FVG and a Bearish FVG overlap each other. Price goes up, creates a Bullish FVG, then immediately comes down and creates a Bearish FVG in the same area. The overlapping area becomes a Balanced Price Range - BPR.

Think of it as a war zone. Buyers and sellers both fought there. Price became balanced for a moment.

Why is BPR important? Because when price comes back to a BPR, it often reacts very sharply. It's a double-defended zone. Both sides have orders there.

I treat BPR as a stronger version of a normal FVG. If I see a BPR on H1, I mark it in a different colour. That's my A+ zone.

The Secret Most Traders Miss: Consequent Encroachment (C.E.) - The 50% Level

Now, here is the pro secret.

You don't always need to wait for price to fill the entire FVG.

In SMC, the middle 50% line of the FVG is called Consequent Encroachment, or C.E.


Many times, price comes back, touches only the 50% level of the gap, gives a rejection, and flies away without filling the whole gap. If you were waiting for a full fill, you missed the trade.

How do I use it? I divide my FVG into two parts. The top 50% is the premium entry, the bottom 50% is the discount. For a Bullish FVG, I watch the C.E. line very carefully. If I get a rejection wick exactly from C.E., I enter early with a smaller position. If price goes deeper to fill the full gap, I add.

This one concept alone changed my win rate. Because now I don't miss trades, and I also don't enter too late.

Pro tip: Draw your FVG box, then draw a dotted line right in the middle. That line is your C.E. Watch how many times price respects that exact line. You will be shocked.

The Final Rule: Invalidation - Wick vs Body Close

Now, one thing you must remember clearly, because this is where 90% of new traders make a mistake.

Suppose you entered a Bullish FVG. Price comes down, makes a long wick below the FVG, and then goes back up. Will you panic and exit?


No. Absolutely not.

Wick = Still Valid.

A wick means price went to that level and got rejected. Sellers tried to push price down, but they failed. Buyers took control again. This actually makes your setup stronger.

Body Close = Invalid.

But if a full candle body closes below the FVG, then the story is over.

It means buyers have lost. The gap is no longer being defended. Your Bullish FVG is no longer Bullish. It has now become an IFVG.

My simple rule:

Wick goes below FVG = Wait.
Body closes below FVG = Exit. Setup is dead.

Where should you put your Stop Loss? Not just below the FVG, not just below the C.E. Put it a little below the entire FVG range, so that one wick doesn't kick you out. And if the body closes, exit yourself, don't wait for the stop loss.

If you follow this one rule, you will never cut a good trade out of fear, and you will never stay stuck in a bad trade.

Common Mistakes Traders Make With FVG

Let me be honest with you. I also made these mistakes when I started.

Mistake 1: Trading every FVG. Not every gap is good. If the gap is too small, ignore it. If it's inside a choppy range, ignore it. Trade only the gaps that are created after a liquidity sweep or a break of structure.

Mistake 2: Entering without confirmation. Just because price entered the gap doesn't mean it will reverse. Wait for a small rejection. One candle of confirmation can save your account.

Mistake 3: Using FVG alone. FVG is not a magic strategy. Combine it with liquidity, market structure, and order block. FVG + Liquidity Sweep + Order Block = High probability setup. FVG alone = gambling.

Mistake 4: Wrong timeframe. FVG on M1 is noise. FVG on H1, H4, Daily is real institutional footprint. Always check the higher timeframe FVG first, then go to lower timeframe for entry.

Final Words

Fair Value Gap is not complicated. It's just the market's footprint.

Price moves fast, leaves a gap, comes back to fill it. That's the whole story.

But if you want to trade like a professional, remember these three words: BISI, SIBI, and C.E.

Know which side was inefficient, know where the 50% line is, and know when a gap has flipped into an IFVG or overlapped into a BPR. That's what separates a retail trader who chases from a smart money trader who waits.

If you learn to wait for that gap instead of chasing price, your trading will change completely. You will take fewer trades, but better trades. You will stop being the liquidity, and you will start trading like the institutions.

So next time you see price flying, don't run after it. Let it go. Let it create an FVG. Then wait patiently. Let it come back to you.

Because in trading, patience doesn't just pay. Patience is the payment.

Share:

What Is a Chart in Forex? And Why Every Trader Sees the Market Differently


Let me be honest with you. When I first opened a trading chart, I had no idea what I was looking at.

It was just red and green lines jumping up and down. It looked confusing. It looked like something only bank people could understand. I closed it after five minutes and thought, this is not for me.

But after a few days, I opened it again. And slowly, I started to understand one simple truth — a chart is nothing but the story of price.

That is it. A chart tells you what happened in the market. Who was strong, buyers or sellers? Where did price go up? Where did it fall? Where did it stop? Everything is drawn in front of you, like a map.

If you don’t understand charts, you cannot trade. You will just be guessing. And guessing in Forex is the fastest way to lose money.

So let’s talk about it in simple language, like a human, not like a textbook.

What is a Chart?

A chart in Forex is a visual picture of price movement over time.

Suppose EUR/USD was at 1.0800 in the morning, went up to 1.0850 in the afternoon, and came back to 1.0820 in the evening. If someone just tells you these numbers, you will forget them. But if you draw them on a graph, you will instantly see — oh, price went up, then came down a little.

That drawing is a chart.

In Forex, every currency pair moves every second. The chart collects all that movement and shows it in a clean way. You can see one minute, one hour, one day, or even one month of price in a single screen.

Traders use charts to find three things:

  1. Trend — Is the market going up, down, or sideways?
  2. Level — Where did price stop before? Where might it stop again?
  3. Entry — Where should I buy or sell with less risk?

Without a chart, you are blind. With a chart, you at least have a chance.

Now, the interesting part. Not all charts look the same. There are different types, and each type shows the same price in a different style. It’s like the same person wearing different clothes. The person is the same, but the look is different.

Let’s talk about them one by one.


1. Line Chart — The Simplest One

A line chart is the most basic chart in Forex.

It takes only the closing price of each candle and connects them with a line. That’s it.

For example, if price closed at 1.0800, then 1.0810, then 1.0805, the line will just join those three points.

It looks very clean. No confusion. No red-green boxes. Just one line going up and down.

Who uses it?
Beginners love it. Long-term investors also love it because they only want to see the big trend, not every small up-down.

  • What works: Filters out market noise and shows the underlying trend instantly.
  • What hurts: Ignores intra-period volatility, highs, and lows — not suitable for precise executions.

I personally use the line chart only when I want to check the bigger picture. Like, “Okay, is this pair in an uptrend on the daily chart?” One look, done.


2. Bar Chart — The Old School One

Before candlesticks became famous, most traders in the West used the bar chart. It is also called OHLC chart.

OHLC means Open, High, Low, Close.

Each bar tells you four things:

  • Open: Where did price start?
  • High: How high did it go?
  • Low: How low did it go?
  • Close: Where did it end?

The bar has a small vertical line. The top of the line is High, the bottom is Low. There is a small tick on the left side — that is Open. A small tick on the right side — that is Close.

If the right tick is higher than the left tick, price went up. If it’s lower, price went down.

  • What works: Gives you complete OHLC information in a compact form.
  • What hurts: Looks messy on screen. Hard to read quickly when you have 100+ bars.

That is why, even though the bar chart is powerful, most new traders leave it after a few weeks and move to candlesticks.


3. Candlestick Chart — The King of Forex

If you ask 100 Forex traders which chart they use, 90 of them will say candlestick.

This chart came from Japan, hundreds of years ago. Japanese rice traders used it. Later, a man named Steve Nison brought it to the West, and it changed trading forever.

A candlestick also shows Open, High, Low, Close — same as a bar chart. But it shows it in a much better way.

Each candle has a body and wicks.

  • Body: The thick part between Open and Close.
  • Upper Wick: The thin line above the body, shows the High.
  • Lower Wick: The thin line below the body, shows the Low.

If the candle is green (or white), it means price closed higher than it opened. Buyers won.

If the candle is red (or black), it means price closed lower than it opened. Sellers won.

A candle might close green, but if it leaves a massive upper wick, it tells you buyers tried to push up and got rejected aggressively. The body shows the close, but the wicks tell you the struggle.

Why is it so popular?

Because candlesticks form patterns. And patterns tell a story.

A long green candle means strong buying. A small candle with long wicks means confusion. A candle with no wick at all means one side fully dominated.

Traders have names for these patterns — Doji, Hammer, Engulfing, Shooting Star, Pin Bar. You don’t need to memorize all of them now. Just remember, candlesticks are not just colours. They are emotions. Fear, greed, confusion, power — everything is inside a candle.

If you want to learn Forex seriously, you must master the candlestick chart. There is no shortcut.


4. Heikin Ashi Chart — The Smooth One

Heikin Ashi means “average bar” in Japanese.

It looks almost exactly like a candlestick chart, but there is a big difference. The candles are not made from real Open-Close prices. They are made from averaged prices.

The formula is a bit technical, but you don’t need to remember it. Just know the result: the chart becomes very smooth.

In a normal candlestick chart, you will see red, green, red, green mixed together even in a strong uptrend. That creates confusion.

In Heikin Ashi, in an uptrend, you will see mostly green candles one after another. In a downtrend, mostly red. No confusion.

  • What works: Perfect for trend followers. You stay in a trade longer because one opposite candle doesn’t scare you out.
  • What hurts: Price you see is averaged, not real. You can’t use it for exact entry.

Many traders use both together. Heikin Ashi for direction, normal candles for entry. It’s a smart combination.


5. Renko Chart — The No-Time Chart

This one is strange at first.

Normal charts have time on the bottom — 1 minute, 5 minutes, 1 hour. Renko has no time.

In Renko, a new brick forms only when price moves a fixed amount. Suppose you set brick size to 10 pips. If price moves up 10 pips, one green brick appears. If it moves another 10 pips, another brick. If price moves only 5 pips and comes back, no brick forms. Nothing happens.

So Renko filters out all the small noise. It only shows real movement.

The chart looks like a staircase of bricks. Very clean. Very easy to see trend.

  • What works: Best for filtering sideways chop. Only real movement creates a brick.
  • What hurts: You lose time information. You don’t know if a brick formed in 1 minute or 1 day.

Renko is not for everyone. But if you are a swing trader who hates noise, you will love it.


6. Point and Figure Chart — The Oldest Trick

Point and Figure, or P&F, is even older than Renko.

It uses X and O instead of candles or bars.

  • X means price went up.
  • O means price went down.

It also ignores time. It only cares about price movement.

If price goes up by a certain amount, you draw an X. If it goes up more, you draw another X on top. When price reverses and goes down, you move to the next column and start drawing O’s.

It looks weird at first. Like a game of tic-tac-toe. But old traders swear by it because it shows support and resistance very clearly.

Today, very few retail traders use it. But in banks and institutions, some old-school traders still use it.

You don’t need to start with this. Just know that it exists.


7. Tick Chart — The Fastest One

A tick chart is for fast traders.

In a normal 1-minute chart, one candle forms every minute, no matter how many trades happened. In a tick chart, one candle forms after a fixed number of trades. For example, after every 100 ticks, one new candle.

So if the market is very active, candles form very fast. If the market is slow, candles form slowly.

Scalpers love this because it shows them the real activity of the market, not just clock time.

  • What works: Shows real market activity, not just clock time.
  • What hurts: Can be too fast and stressful for beginners. Your screen keeps changing.

Why Every Trader Sees the Same Market Differently

Here is a funny reality about trading: two people can look at the exact same EUR/USD chart at the exact same second, and one will see a clear buy while the other sees a clear sell.

Why? Because they are using different lenses.

A scalper using a 1-minute tick chart only sees short-term panic and noise. A swing trader using a daily candlestick chart sees strong institutional accumulation. One trader looks at a Renko chart to block out sideways chop, while another uses Heikin Ashi to ride the smooth trend.

The market is just price moving on a screen. But how you filter that price — and the timeframe you look through — defines your entire reality as a trader.

So, Which Chart Should You Use?

This is the question everyone asks me.

My honest answer: Start with candlesticks.

Learn line chart for big picture. Learn candlestick for real trading. Once you are comfortable, try Heikin Ashi for trend confirmation.

Don’t jump to Renko or Point and Figure in the beginning. You will get confused. Master one first.

Remember, the chart does not make you money. Your decision makes you money. The chart is just a tool. Like a knife in a kitchen. A good chef can make great food with a simple knife. A bad chef will cut his finger even with the best knife.

So don’t keep changing charts, indicators, and strategies. Pick one chart, understand price, practice on demo, and be patient.

In Forex, patience is the real strategy. The chart will teach you everything else, slowly, day by day.

If you are reading this and you are still confused about charts, that is normal. We all were confused at the start. Open your trading platform today, put a candlestick chart, zoom out, and just watch price for 30 minutes without trading. Don’t think about money. Just watch how price moves, stops, turns. That is the first lesson.

The market is always talking. The chart is its language. Learn the language, and you will start to understand what the market is trying to say.

Share:

Who Controls Forex Market? The 4-Tier Interbank Pyramid

Retail is less than 5.5% of daily FX volume. Learn the 4-tier interbank pyramid and how to follow central bank liquidity order flow.

You think you move the market? I thought so too for two years. I used to get angry at the market when my trade lost, as if the market was personally targeting me.

Then I saw the data from the Bank for International Settlements. The Forex market trades $7.5 Trillion every single day. The entire retail Forex community combined, all of us on MetaTrader 4 and 5 around the world, we account for less than 5.5% of that volume.


We are plankton in an ocean filled with whales. We do not control anything. And once you accept that, your trading will change forever.

The market is a strict hierarchy, a pyramid of power and order flow.

Level 1: The Gods - Central Banks and Monetary Policy

At the absolute top are the Central Banks. The US Federal Reserve, The European Central Bank, The Bank of Japan, and The Bank of England.

These are not traders. These are the institutions that actually create and control the supply of money.


Their primary weapon is the interest rate. And here is where Hawkish vs Dovish comes in, which most beginners miss.

When a central bank is Hawkish, it means it wants to fight inflation by raising interest rates. Higher interest rates attract global capital. For example, when the Federal Reserve raised interest rates from 0.5% to 5.5% in 2022-2023, they were extremely hawkish. Global capital worth trillions flowed into the US to get that 5.5% yield. As a direct result, EUR/USD crashed over 2000 pips.

When a central bank is Dovish, it means it wants to support the economy by cutting interest rates and printing money. Lower interest rates make the currency less attractive. Money flows out. The currency falls. For example, when the Fed starts cutting rates, as expected in 2026, money will flow out of USD and into EUR and GBP, causing EUR/USD to rally.

Their secondary weapon is direct intervention. The Bank of Japan is famous for this. When USD/JPY gets too high, say 150.00, the BOJ will directly enter the market and sell billions of dollars to buy Yen, causing a 500-pip drop in minutes.

If you are a swing trader, your entire trading bias should come from central bank analysis. Is the Fed hawkish or dovish? That single question determines the trend for the next 6 months.

Level 2: The Whales - Tier 1 Interbank Market

Just below central banks is the real heart of Forex: The Tier 1 Interbank Market. This is a private network of the 10 largest banks in the world.

JP Morgan Chase, Citi, Goldman Sachs, Bank of America, Deutsche Bank, Barclays, UBS, HSBC. These 10 banks handle approximately 68% of all daily Forex volume.

When Apple needs to convert 2 billion Euros to Dollars, it calls JP Morgan. When these banks trade with each other, they trade in minimum sizes of $10 million through platforms like EBS and Reuters.

This is where real price discovery happens. And here is the critical part for you. These banks can see the order book. They can see where retail traders have placed their stop losses.

How do algorithms target liquidity? Modern Tier-1 banks use sophisticated algorithms that scan for liquidity pools. A liquidity pool is a cluster of stop losses just below support or just above resistance.

If 100,000 retail traders have their stop loss at 1.0850 below a support level, the algorithm will push price to 1.0845, take all that liquidity which gives the bank a better price to buy millions of units, and then rally hard. This is what we call a Liquidity Sweep, Stop Hunt, or False Breakout.

And this is why your perfect support and resistance trading strategy keeps failing. You are not wrong about support, you are just being used for liquidity by an algorithm designed to do exactly that.


Level 3: The Sharks - Hedge Funds and Corporations

Below the interbank market are the sharks. Massive hedge funds like Bridgewater and BlackRock, prime brokers, and multinational corporations like Amazon and Tesla who need to exchange currency daily for international trade.

They trade in sizes of hundreds of millions. They use complex algorithmic trading and high-frequency trading systems. They create the choppy price action you see during news events.

Level 4: The Plankton - Retail Traders and Small Brokers

At the very bottom, we are here. The retail trader with a $100 to $10,000 account trading on MT4/MT5 through a retail broker like Exness or IC Markets.

Here is a truth most brokers will never tell you. When you click BUY on 0.10 lot EUR/USD, your trade often never goes to the real interbank market. Most retail brokers operate a B-book model. They take the other side of your trade internally. If you lose, they profit directly.

Since statistics show that 75 to 85% of retail traders lose money, this is a very profitable business model for them.

How Do We Win Then?

We stop playing the retail game. We stop using lagging indicators like RSI, MACD, and moving averages that every other retail trader uses.

Instead, we start studying institutional market structure. We study Smart Money Concepts.

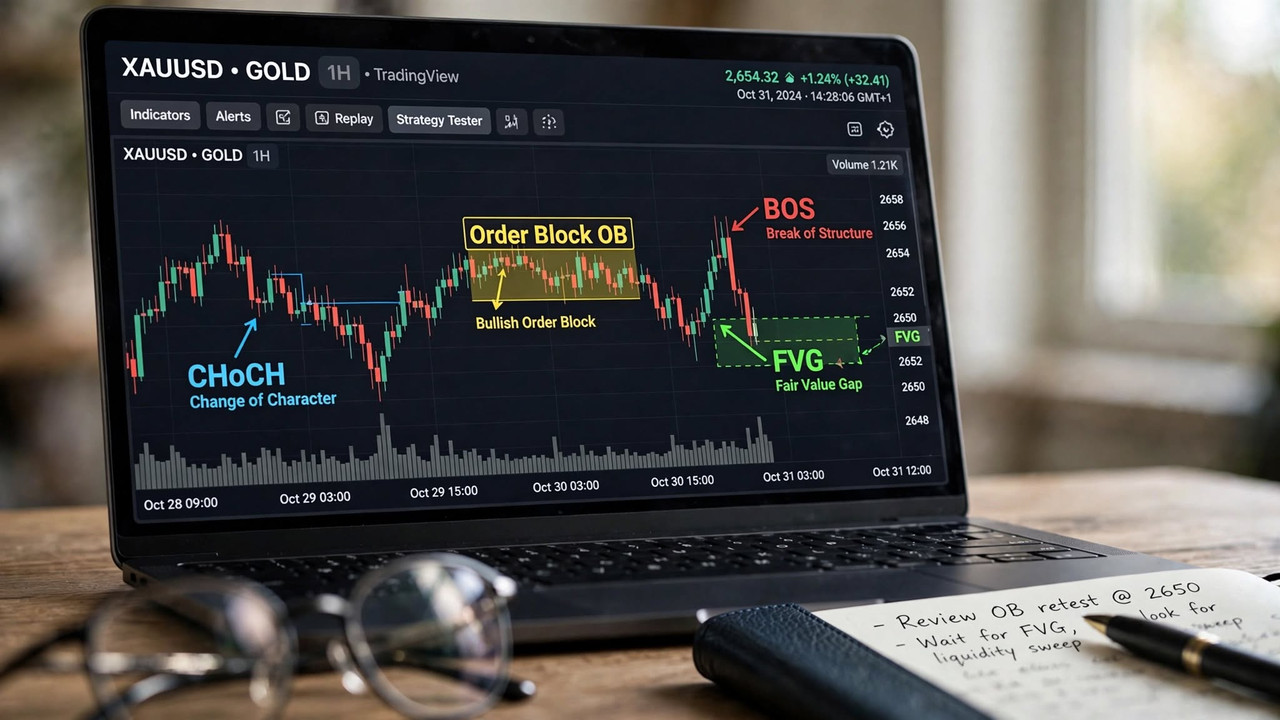
We learn to identify where Tier 1 banks have placed their Order Blocks. We learn to spot Fair Value Gaps that indicate institutional buying. We learn to trade Break of Structure and Change of Character which show when institutions have shifted direction.

We don't try to move the market. We follow the footprints of those who do. When you see price take sell-side liquidity and then print a strong bullish Break of Structure, you don't ask questions. You buy with the banks.

Understand this pyramid of power. Respect it. Trade with it, not against it. This is the difference between low-value retail trading and high-value institutional trading.

Share:

What is Lot Size in Forex? Leverage and Pips Explained

Stop risking account blowouts. A professional trader's guide to understanding pips, lot sizing math, and why high broker leverage is a trap.

Let me tell you exactly how I blew my first $100 account in 47 seconds.

I deposited $100 into a broker offering 1:1000 leverage. I thought I was a genius. I can control $100,000 with $100! I opened a 1.00 lot trade on EUR/USD without a stop loss. EUR/USD moved 10 pips against me. My account went from $100 to $0. Margin call. Liquidated. I sat there staring at the screen, not even understanding what a pip was.


No YouTube video had explained lot size, leverage, and pips in simple human language. So let me explain it to you like we are sitting in a cafe, because if you don't understand this math, no trading strategy can save you.

What is a Pip? The Universal Language

Forget dollars for a second. Professional institutional traders never say "I made $500 today." They say "I made 50 pips today."

A pip is the fourth decimal place for most major pairs. If EUR/USD moves from 1.08500 to 1.08600, that is a 10-pip move.

For Japanese Yen pairs like USD/JPY, a pip is the second decimal place. If USD/JPY moves from 150.00 to 150.10, that is a 10-pip move.

Why does this matter? Because pips are universal and emotionless. A system that makes 200 pips a month is a good system, whether you trade 0.01 lot or 10 lots. The lot size just magnifies the dollar value. When you learn to think in pips, you remove greed and focus on execution quality.


What is Lot Size? The Size of Your Risk

Lot size is simply how much currency you are buying or selling. This is where 90% of beginners get destroyed.

There are three core lot sizes.

Micro Lot - 0.01 Lot equals 1,000 units. This is your learning lot. With 0.01 lot, 1 pip equals $0.10. So if you make 50 pips, you make $5. If you lose 50 pips, you lose $5. Your $100 account can survive a 500-pip losing streak.

Mini Lot - 0.10 Lot equals 10,000 units. Now, 1 pip equals $1. So 50 pips equals $50. This is for traders who have grown their account to at least $1,000.

Standard Lot - 1.00 Lot equals 100,000 units. This is institutional size. 1 pip equals $10. So 50 pips equals $500. To trade this safely, you need at least a $10,000 account.

Here is your reference table:

Contract Type
Lot Size
Units
Pip Value on EUR/USD
Min Account
Micro Lot
0.01
1,000

~$0.10

$100 - $500

Mini Lot
0.10
10,000

~$1.00

$1,000 - $2,500

Standard Lot
1.00
100,000

~$10.00

$10,000+

The golden rule used by every prop firm and Tier-1 bank trader is: Never risk more than 1 to 2% of your total account equity on a single trade.

Real Margin Math Example - The Missing Piece

Let me show you the exact math I use every day. Let's say you have a $500 account. You want to risk 1% per trade. So 1% of $500 is $5. That is your maximum loss per trade.

Now you find a setup on EUR/USD. Your stop loss needs to be 25 pips away based on market structure.

How do you calculate lot size? The formula is: Lot Size = Risk Amount / (Stop Loss in Pips * Pip Value per Micro Lot)

So $5 / (25 pips * $0.10) = $5 / $2.50 = 2 micro lots = 0.02 lot.

So with a $500 account, 25 pip stop loss, 1% risk, you should trade 0.02 lot. If your stop loss was only 10 pips away, you could trade 0.05 lot. If your stop loss was 50 pips away, you can only trade 0.01 lot.

This is how professionals do it. They don't pick a random lot size. They calculate it based on stop loss distance and account risk.

What is Leverage? The Trap

Brokers advertise 1:500 and 1:1000 leverage like it's a gift. It is not. It is a loan that removes your safety net.

1:100 leverage means with your $100, you can control $10,000.
1:1000 leverage means with your $100, you can control $100,000.

Here is the trap. High leverage does not increase your profit potential if you use proper lot size. It only increases your ability to make a catastrophic mistake.

With low leverage like 1:100, your broker will simply not allow you to open a 1.00 lot trade with $100. It will give you an error: Not enough margin. That error just saved your account.

With 1:1000 leverage, your broker WILL allow you to open that 1.00 lot trade. And you will lose your $100 in 10 pips.


This is why professional institutions and prop firms cap leverage at 1:10 to 1:50. I personally trade with 1:100 leverage and I have never needed more. Anything above 1:200 is a marketing trap designed to encourage over-leveraging, which is how B-book brokers profit from your losses.

Master this math, and your account will survive long enough to become profitable.

What's Next: You now know when to trade and how much to risk. But do you know who you are trading against? You are fighting Tier-1 banks. Read Article 3 to understand the pyramid of power.

Share:

Forex Market Sessions Explained - Best Time to Trade Forex

 Discover why Forex isn't tradable 24 hours. Learn the true institutional schedule behind London, New York, and the 4-hour golden overlap window.

If you have ever sat in front of your chart at 3 AM wondering why nothing is moving, you are not alone. I did the same for my first 6 months and I paid for it with my time, my sleep, and my spread.

Everyone tells you Forex is open 24 hours. That's technically true. But the more important truth is this: Forex is only tradable for about 8 hours a day. The rest of the time is either dead, manipulative, or designed to hunt your stop loss.


The Forex market is not one single market. It is a network of 4 major sessions, and each session has a completely different personality based on who is controlling the order flow at that moment.

1. The Sydney Session - The Sleep Zone [10 PM - 7 AM GMT]

Sydney opens the trading week on Monday. It is the quietest session of all.

Total volume is less than 5% of daily volume. Spreads are wider, price moves are random and choppy. Who trades here? Mostly Australian and New Zealand banks and small retail traders who don't know better.

Unless there is a big news release from the Reserve Bank of Australia, there is zero reason to be here. What I do during Sydney is simple. I shut down my charts. I journal my previous day. I plan my London session. I do not place a single trade.

If you are a beginner, this is the best advice I can give you. Avoid Sydney completely. It will save you at least 20% in unnecessary losses and mental fatigue. Your account will thank you.

2. The Tokyo / Asian Session - The Range Setter [12 AM - 9 AM GMT]

Tokyo accounts for about 20% of daily volume. It is much more important than people think, but not for the reason you think.

The main characteristic of Tokyo is that it is an accumulation session. The market typically moves in a tight 30 to 50 pip range. Japanese exporters, the Bank of Japan, and Asian hedge funds are not trying to create a trend. They are slowly building their positions, accumulating buy and sell orders.

Professional Smart Money traders have a name for this: The Asian Range.

And here is the secret that changed my trading forever. 80% of the time, the London session will first take out the high or low of the Asian Range to grab liquidity, and only then move in the real direction. We call this the Asian Range Liquidity Grab.

For example, if EUR/USD was stuck between 1.0850 and 1.0870 during Asia, expect London to first spike down to 1.0840, take all the buy stops of early sellers, collect all that liquidity, and then rally hard to 1.0900. If you don't understand this structure, you will always be stopped out before the real move even starts.

Best pairs to watch during Tokyo: USD/JPY, EUR/JPY, AUD/JPY, AUD/USD. If you are a support and resistance range trader, this session is perfect for you because it respects range very well.


3. The London Session - Where Real Money Is Made [8 AM - 5 PM GMT]

This is where I make 60% of my money. London is the financial capital of Forex. When London opens, over 35% of all Forex transactions in the world happen.

Why? Because this is where Tier-1 banks like JP Morgan, Deutsche Bank, Citi, Barclays, and Goldman Sachs have their main trading desks. When those desks open, they bring with them billions of dollars in interbank order flow, institutional liquidity, and corporate orders.

What does that mean for you? It means volatility and direction. If Asian session was sideways accumulation, London is manipulation and expansion.

A common pattern you will see every single day is the London Open Judas Swing. At exactly 8:00 AM GMT, there is a fake move. Price will spike 20 pips one way, take out all the early liquidity, trap breakout traders, and then reverse and run 100 pips the other way. It's called Judas because it betrays the early traders.

My rule that saved my account: Never trade the first 30 minutes of London. Let the Judas Swing happen. Let the stop hunt complete. At 8:30 AM GMT, look at the 30-minute candle close. Where did price take liquidity? That tells you the real direction for the day. Then enter with the banks, not against them.

Best pairs during London: EUR/USD, GBP/USD, GBP/JPY, EUR/GBP. These pairs can easily move 100 to 150 pips during London alone.


4. The New York Session and The Golden Overlap - Why Spread Goes to Zero [1 PM - 10 PM GMT]

New York is the most volatile session because all major US economic data like NFP, CPI, and FOMC are released at 8:30 AM New York time.

But the real magic is not New York alone. It is the London-New York Overlap from 1 PM to 5 PM GMT.

For 4 hours, the two biggest financial centers in the world are open at the same time. Let me explain why spread goes to zero here, which no one explains.

Spread is the difference between buyers and sellers. During Sydney, there are few buyers and sellers, so brokers increase spread to 2-3 pips to protect themselves.

During the Overlap, you have London banks AND New York banks, plus all US hedge funds and corporations, all providing liquidity at the same time. There are millions of buyers and sellers every second. Because liquidity is so massive, brokers can offer 0.0 pip spread and still make money from commission.

Volatility also expands during this time for the same reason. When you have that much order flow fighting, price moves fast and clean. Trends established during London often continue or reverse aggressively during the overlap.

If you have a full-time job, listen carefully. You don't need to trade 8 hours. You only need to trade these 4 hours. More than 70% of my entire monthly profit comes from just this 1 PM to 5 PM GMT window. I check charts at 1 PM, find a liquidity grab setup, enter, and I'm done by 4 PM.

Master the session timing, and you master 50% of Forex.

What's Next: Now that you know when to trade, you must master how much to risk per trade. A perfect entry with the wrong lot size will still blow your account. Continue to Article 2.

Share:

Validating Order Blocks: Why Imbalance (FVG) Is a Mandatory Prerequisite

What is this concept?

Think of order blocks as cars. Some are Ferrari, some are broken old cars. They all look like cars, but only Ferrari will go fast. How do you know which order block is Ferrari? You check the engine. The engine is the FVG - Fair Value Gap, also called Imbalance.

What is FVG? It is a gap where price moved so fast, no trading happened. Take 3 candles. In bullish FVG, candle 3 low is higher than candle 1 high. There is empty space between them. That empty space is gap. In bearish FVG, candle 3 high is lower than candle 1 low.


Why does this gap happen? Because banks don't trade slowly. When they buy 300 million GBP/USD, they buy at any price. They don't wait for a discount. So price jumps. That jump leaves a gap. That gap is proof of aggressive institutional buying or selling.

So why is FVG mandatory? Because without FVG, your order block has no power. Many beginners mark every last opposite candle as order block. They find 20 order blocks a day. And 15 of them fail. Why? Because there was no real bank power behind them. It was just normal slow market.

An order block WITH an FVG means: Source + Power. Source is the OB candle. Power is the FVG. You need both. FVG filters out weak OBs. It is your quality control. My own trading improved 70% when I started using this rule: No FVG, No Trade.

Step-by-Step Rule: How to Identify it on the Chart

1. Find a potential OB with BOS/CHoCH. Don't start with FVG. Start with order block logic. Find a potential bullish or bearish OB that has a clear BOS. For example, on EUR/USD H1 you see price break a swing high - BOS - and before that there is a small red candle. That is potential bullish OB. Mark 10 such potential OBs on your chart.

2. Now filter with FVG - The 70% Rule. Go through your 10 OBs. For each bullish OB, look immediately after. Is there a clear bullish FVG? The gap should be obvious without zooming. At least 5-10 pips on H1, 3-5 pips on M15. For bearish OB, look for bearish FVG right after. If you have a clear FVG, keep the OB. If gap is tiny or no gap, delete the OB. This is strict filtering. Out of 10, you will keep only 2 or 3. Those 2-3 are high-quality validated OBs. This one step saves you from overtrading.


3. Check the Killzone Session Filter. Now check WHEN that FVG was created. A FVG created in Asian session at 01:00 GMT is weak. Volume is low. The gap might get filled instantly. But a FVG created during London Killzone 07:00-10:00 GMT or New York Killzone 12:00-15:00 GMT is powerful. It has huge volume behind it. So add this rule: Your validated OB + FVG combo must have been created during London or New York Killzone. For example, a bullish OB + FVG that formed at 08:15 GMT London open on GBP/USD is 3x more powerful than one formed at 02:00 GMT.

4. Multi-Timeframe Top-Down Validation. Validate on higher timeframe, execute on lower. Use H4 or H1 to find your validated OB + FVG. That is your big zone. For example, H1 GBP/USD has a validated bullish OB at 1.2600-1.2610 with a bullish FVG 1.2610-1.2625, formed in London Killzone and breaking a swing high. Now when price comes back to that H1 zone, go to M15. On M15, wait for price to enter the FVG/OB area and then show a CHoCH - a small bullish break of structure - or a bullish market structure shift. That M15 CHoCH inside H1 FVG is your entry confirmation. This top-down method proves that lower timeframe buyers agree with higher timeframe banks.

5. Trade Management, Entry, SL and Invalidation. This is how you turn validation into money.

Entry: Don't enter at random. Best entry is at 50% Equilibrium of the order block, which often overlaps with 50% of the FVG. This is the mean threshold. It gives you best risk-to-reward. You can also enter at OB Open price.

Stop Loss: For validated bullish OB, place SL 2-3 pips below OB low wick AND below FVG low. For validated bearish OB, SL 2-3 pips above OB high wick AND above FVG high. This protects you from wick hunts.

Real Example: GBP/USD M15, New York Killzone 13:30 GMT. You see a bearish OB at 1.2720-1.2730 (small green candle) after grabbing buy-side liquidity at 1.2735, then price drops with bearish FVG 1.2710-1.2720 and breaks swing low. This is validated bearish OB. Next hour, price rallies back to 1.2725 which is 50% of OB. On M5, you see a bearish CHoCH - price breaks a small higher low. You sell at 1.2725, SL at 1.2733 (3 pips above OB+FVG), TP1 at 1.2695 (1:2 RR), TP2 at next low.


Trade Management: Professional rule - Minimum 1:2 or 1:3 risk-to-reward. Never take 1:1. If SL is 10 pips, TP must be 20-30 pips. When price reaches +1R (10 pips profit), move SL to breakeven. So you can't lose. Book 50% profit at 1:2 RR. Let remaining 50% run to 1:3 or next liquidity with trailing SL. This way even if win rate is 50%, you are profitable.

Invalidation: When does validated OB fail? Two rules. One: If candle BODY closes beyond OB - body close below bullish OB low, or above bearish OB high - the OB is invalid. Two: If FVG is fully mitigated 2-3 times, the imbalance is filled and power is gone. Fresh validated OBs are best.

Common Mistakes to Avoid

  • Marking every tiny gap as FVG. A real institutional FVG is big and obvious. If you need to zoom 400% to see a 1-pip gap, it is not valid. Look for clear 5+ pip gaps on H1, 3+ pips on M15.
  • Trading FVG alone without OB. Some traders see a big FVG in middle of nowhere and buy it. Price often just fills it and continues. FVG alone is not enough. You need OB as source + BOS as structure break + FVG as power. All three together make A+ setup.
  • Ignoring session context. A validated OB + FVG that formed in slow Asian session will often fail even if it looks perfect. Always check the clock. London and New York Killzones produce the only reliable imbalances because that is when real money moves.

Practical Summary - Checklist

  • Did I start with OB + BOS/CHoCH? Not just random candle?
  • Is there a LARGE, OBVIOUS FVG right after the OB? Not tiny 1-pip gap?
  • Was the OB+FVG combo created in London 07:00-10:00 GMT or New York 12:00-15:00 GMT Killzone?
  • Is it fresh? Has FVG not been fully filled 3 times?
  • Did I use H4/H1 for validation and M15/M5 for CHoCH entry confirmation?
  • Entry at 50% Equilibrium, SL 2-3 pips beyond OB+FVG, minimum 1:2 RR?
  • Trade Management: Move to breakeven at +1R, book 50% at 1:2, let rest run?
  • Invalidation: Body close beyond OB = setup cancelled?
Share:

About Us

Must Profit FX is an independent educational and research platform dedicated to decoding institutional market behavior. Built on the core principles of Smart Money Concepts (SMC) and advanced Trading Psychology, we help independent traders replace emotional noise with rule-based structural clarity. Our research focuses on market liquidity sweeps, order block mitigations, and disciplined risk architecture across global currencies and indices—fostering complete trader self-sufficiency without reliance on lagging indicators or signals.

SMC RESEARCH & MARKET PSYCHOLOGY

MUSTPROFIT FX

Independent Smart Money Concepts (SMC) research and market psychology education platform across global currencies, commodities, and index markets. Strictly for educational purposes.